Recent pieces have focused on the likely path to higher interest rates. This is a major problem for all bond investors, especially if you have 40% or more allocated to bonds. The vast majority of investors own bonds.
I believe the bond market is experiencing a long-term secular bull peak. With rates so low, perhaps that is not such a stretch in thinking.
Low bond yields mean low returns. Low yields mean a much greater loss when interest rates rise. A more flexible and unconstrained approach to fixed income, in my opinion, is required. Today, I share a simple bond strategy that you can implement yourself. I believe you’ll find it useful.
Included in this week’s On My Radar:
- Marty Zweig/NDR – A Simple Tactical Bond Market Model
- S&P Seasonality – Sell in May or Maybe by April 21
- Trade Signals – What Was I Thinking
Marty Zweig/NDR – A Simple Tactical Bond Market Model
I am a big fan of the late Marty Zweig. In my early days at Merrill Lynch, I used to subscribe to far too many newsletters. My head would spin with the many differing opinions, yet one of my favorites was The Zweig Forecast. He was good. His newsletter was the top market advisory service for the 15 year period between 1980 and 1995. Zweig Forecast delivered a 16 percent per annum compounding return, the highest risk-adjusted return of any market advisory service during that time.
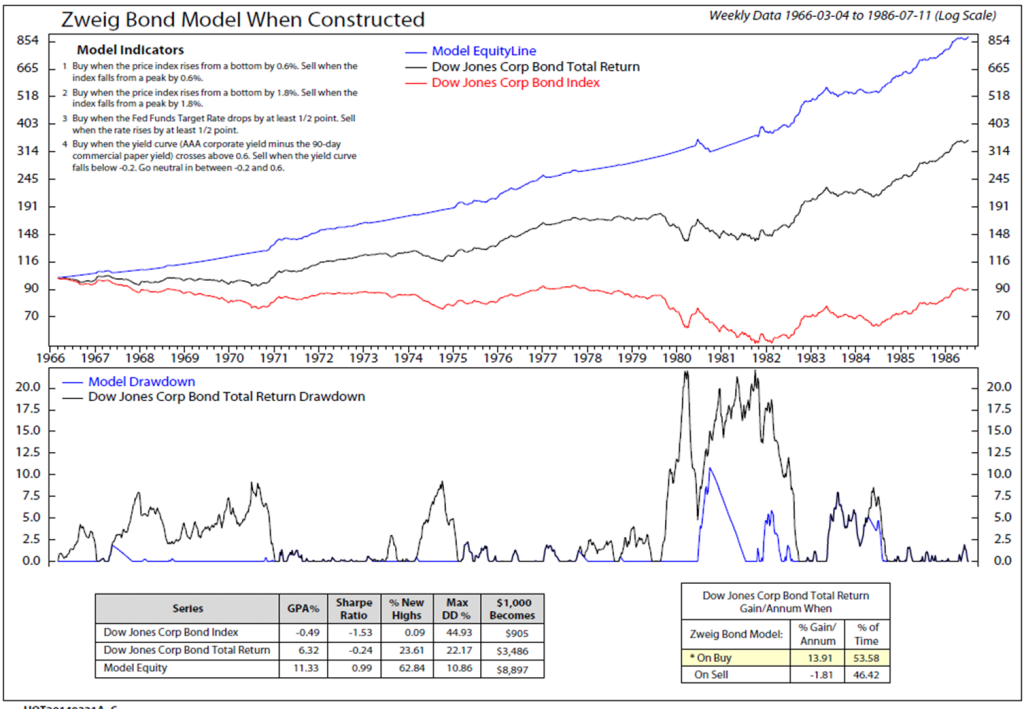
So it caught my eye this week when Ned Davis put out a piece in tribute to his long time friend. What also interested me was that Marty and NDR created the bond model I’m about to describe back in 1986. Marty wanted a bond trend following model that could instruct individuals to shorten or lengthen one’s bond market exposure. The idea, of course, is to avoid rising rate periods – protecting your principal. Marty used it in his book, Winning With New IRAs.
Here is a look at the performance of that model when it was constructed in 1986.

Back then, there was far less computing power. Ned favored adding a 5 indicator (number 3: 50-day moving average below) but Marty felt that it would be difficult for individuals to calculate and follow. Today you can easily view and calculate the 50-day moving average with data and charts from Yahoo, Morningstar or Google on your phone, iPad or computer while sitting on the beach. We’ve come a long way.
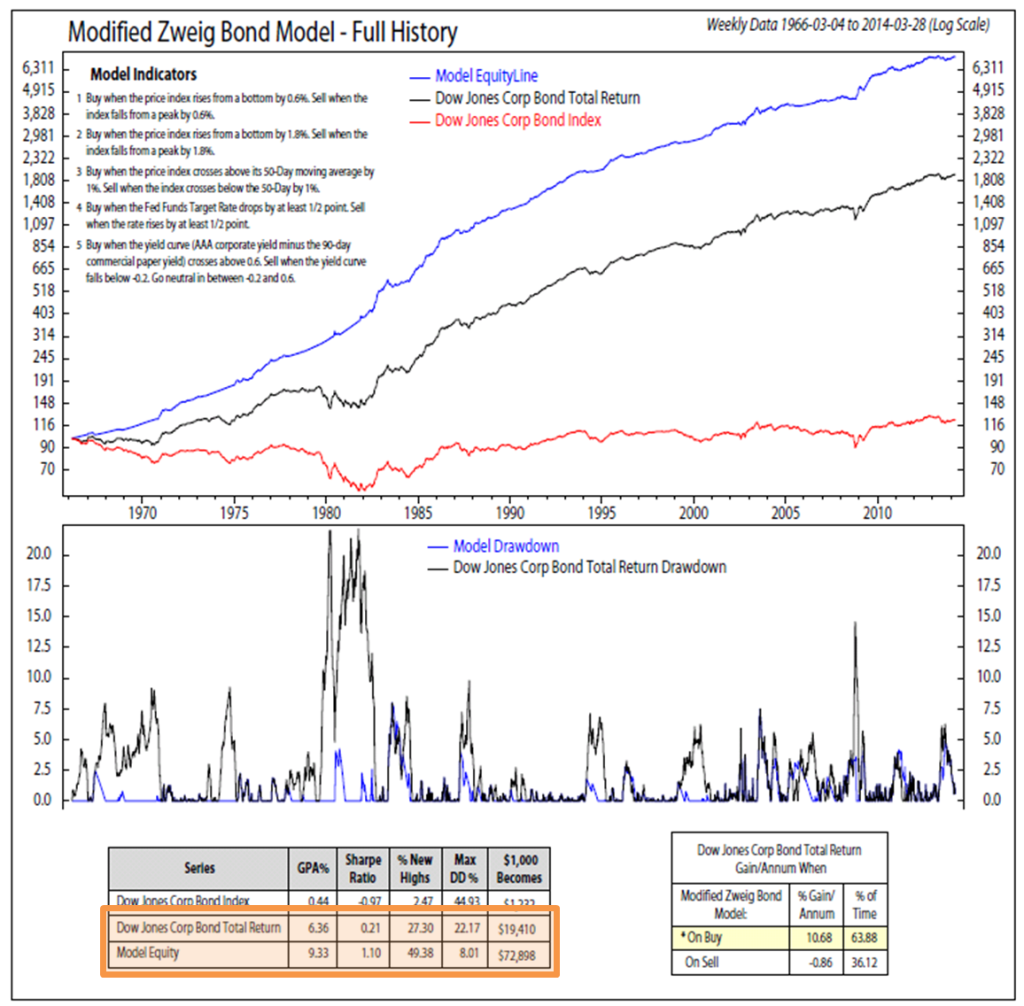
So NDR enhanced the model to include the 50-day moving average (number 3 below) and updated it through March 2013. Here is how the tactical model works:
- Buy when the price index (Dow Jones Corp Bond Index: the red line in above chart and the below chart) rises from a bottom price low by 0.6%. Sell when the index falls from a peak price by 0.6%. Score +1 if a buy and -1 if a sell.
- Buy when the price index rises from a bottom price by 1.8%. Sell when the index falls from a peak price by 1.8%. Score +1 if a buy and -1 if a sell.
- Buy when the price index crosses above its 50-day moving average by 1%. Sell when the index crosses below the 50-day by 1%. Score +1 if a buy and -1 if a sell.
- Buy when the Fed Funds Target Rate drops by at least ½ point. Sell when the rate rises by at least ½ point. Score +1 if a buy and -1 if a sell.
- Buy when the yield curve (AAA corporate yield minus the 90-day commercial paper yield) crosses above 0.6. Sell when the yield curve falls below -0.2. Go neutral in between -0.2 and 0.6. Score +1 if a buy. Score a -1 if a sell and 0 if neutral.
- Buy a total bond market ETF like BND (the Vanguard Total Bond Market ETF) or AGG (iShares Barclays Aggregate Bond Index ETF) if the aggregate score is positive (adding the results of 1 through 5). Buy BIL (SPDR Lehman 1-3 Month T Bill ETF) if the aggregate score is negative.

I highlighted the relevant performance information in orange. Note the total return of the model is 9.33% vs. the DJ Corporate Bond Total Return Index of 6.36%. Also note how smooth the journey was (blue line at the top of the chart) relative to the index (black line at the top of the chart). The red line is the price of the index absent the yield.
I’ll do some deeper digging and consider posting information on this model more frequently; however, this is something you can do on your own too. Given today’s low current interest rates and the significant risk of rising rates over the next five years, now is a good time to allocate to tactical bond funds and strategies. Send me an email if you’d like to learn more.
Source: NDR Bond Fusion Analysis March 31, 2014
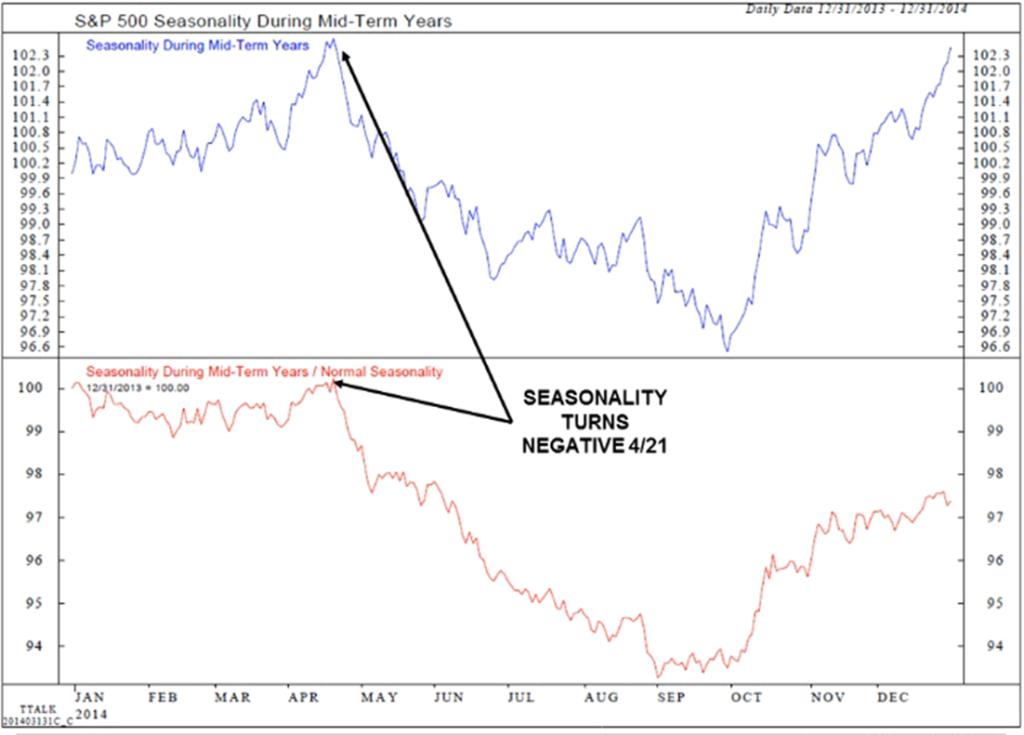
S&P Seasonality – Sell in May or Maybe by April 21
I’m adding this chart today. It takes a look at seasonal tendencies during mid-term election years. As I concluded in this week’s Trade Signals below – HEDGE that equity exposure.

Trade Signals – What Was I Thinking
If you have yet to put some form of portfolio protection in place, I believe it wise to have it in place by month end. I’m referring specifically to your long-term equity portfolio exposure (your stocks for the long run). I do not believe it necessary to hedge your tactical or alternative allocations as they should have risk management processes built in.
I believe most investors are ill-prepared for the end of QE. Valuations are high, margin debt is at a record high and sentiment reflects a far too optimistic investor mindset. Complacency comes to mind.
We are fives years into the Fed’s unprecedented near-zero interest rate policy, their experimental currency creation and historic bond market participation (manipulation).
Timing, of course, is difficult as the Fed can continue to invent; however, they are clearly preparing the market for a change in their behavior. There is a limit to all things. It is time to prepare as the risk of a major event looms large.
Seasonal trends point to a May to October correction. A 5% to 20% correction would not surprise me. I believe something far bigger remains a bit farther down the road.
The end of QE is no small event (see here for the Likely Path to Higher Interest Rates). Neither the stock nor the bond markets do well in an up interest rate environment. My best guess is that the serious fireworks begin in mid-to-late 2015 (tied to an aggressive Fed exit).
As famed hedge fund manager, Seth Klarman, recently wrote in a private letter to clients:
“When the markets reverse, everything investors thought they knew will be turned upside down and inside out. ‘Buy the dips’ will be replaced with ‘what was I thinking?’ Anyone who is poorly positioned and ill-prepared will find there’s a long way to fall. Few, if any, will escape unscathed.”
It is for this reason that I like a new 60/40. Call it 30/30/40. 30% Equities (smartly hedged), 30% Fixed Income (flexible bond funds/strategies), 40% Tactical (broad asset allocation flexibility – relative strength, trend following, sector rotation, risk managed strategies, etc.).
Click here for a link to Wednesday’s Trade Signals.
Trade Signals identifies the equity and fixed income markets’ cyclical trend and suggests ways to hedge your long-term focused equity exposure tied to periods of excessive investor optimism. Charts are posted weekly on Wednesdays.
Conclusion
In his book, Zweig says, “People somehow think you must buy at the bottom and sell at the top to be successful in the market. That’s nonsense. The idea is to buy when the probability is greatest that the market is going to advance”. Zweig used fundamental company data to select stocks to buy while the market is positive.
The inspiration behind a number of Martin Zweig’s methods came, he said, from Jesse Livermore. Livermore was considered one of the greatest speculators who ever lived and was the subject of a book titled Reminiscences of a Stock Operator. It remains one of the most widely read and highly recommended investment books ever written. It was the first book my good friend John Ray handed to me in 1984. He added, “I want it back”. A must read book.
Also, I’ll add that William O’Neil’s highly successful CANSLIM investing method shares a number of features with Zweig’s methods. Thank you, Marty, for all your accomplishments which have enriched us all.
I’m in NYC Tuesday morning speaking about “smart beta” at the New York Society of Securities Analysts (NYSSA) Conference Center. Here is a link to the agenda, http://expertseries.org/ (scroll down to the hyperlink “Agenda-Wealth Management).
The audience will be comprised of approximately 200 end users of ETF products and strategies. Then I fly to Seville, Spain to visit my daughter, Brianna. She is a Penn State junior studying abroad. Studying may be a generous word; more like a European vacation with school credit. Anyway, I love her endlessly; I miss her and sure am looking forward to seeing her.
I then travel to Del Ray Beach, Florida in late April to speak at Randy Verlin’s annual Advisor Conference. They are a great group of approximately 70 independent investment advisors. Randy is an infectiously optimistic and sincere human being. This is my fourth year presenting and I really look forward to spending time with Randy and his team.
Click here to learn more about tactical investing and download our new white paper at CMG AdvisorCentral.
Wishing you a great weekend!
With warm regards,
Steve
Stephen B. Blumenthal
Founder & CEO
CMG Capital Management Group, Inc.
Philadelphia – King of Prussia, PA
steve@cmgwealth.com
610-989-9090 Phone
610-989-9092 Fax
IMPORTANT DISCLOSURE INFORMATION
Please remember that past performance may not be indicative of future results. Different types of investments involve varying degrees of risk. Therefore, it should not be assumed that future performance of any specific investment or investment strategy (including the investments and/or investment strategies recommended and/or undertaken by CMG Capital Management Group, Inc. (or any of its related entities-together “CMG”) will be profitable, equal any historical performance level(s), be suitable for your portfolio or individual situation, or prove successful. No portion of the content should be construed as an offer or solicitation for the purchase or sale of any security. References to specific securities, investment programs or funds are for illustrative purposes only and are not intended to be, and should not be interpreted as recommendations to purchase or sell such securities.
Certain portions of the content may contain a discussion of, and/or provide access to, opinions and/or recommendations of CMG (and those of other investment and non-investment professionals) as of a specific prior date. Due to various factors, including changing market conditions, such discussion may no longer be reflective of current recommendations or opinions. Derivatives and options strategies are not suitable for every investor, may involve a high degree of risk, and may be appropriate investments only for sophisticated investors who are capable of understanding and assuming the risks involved. Moreover, you should not assume that any discussion or information contained herein serves as the receipt of, or as a substitute for, personalized investment advice from CMG or the professional advisors of your choosing. To the extent that a reader has any questions regarding the applicability of any specific issue discussed above to his/her individual situation, he/she is encouraged to consult with the professional advisors of his/her choosing. CMG is neither a law firm nor a certified public accounting firm and no portion of the newsletter content should be construed as legal or accounting advice.
This presentation does not discuss, directly or indirectly, the amount of the profits or losses, realized or unrealized, by any CMG client from any specific funds or securities. Please note: In the event that CMG references performance results for an actual CMG portfolio, the results are reported net of advisory fees and inclusive of dividends. The performance referenced is that as determined and/or provided directly by the referenced funds and/or publishers, have not been independently verified, and do not reflect the performance of any specific CMG client. CMG clients may have experienced materially different performance based upon various factors during the corresponding time periods.
CMG SR Tactical Bond FundTM, CMG Global Equity FundTM and CMG Tactical Futures Strategy FundTM: Mutual Funds involve risk including possible loss of principal. An investor should consider the Fund’s investment objective, risks, charges, and expenses carefully before investing. This and other information about the CMG SR Tactical Bond FundTM, CMG Global Equity FundTM and CMG Tactical Futures Strategy FundTM is contained in each Fund’s prospectus, which can be obtained by calling 1-866-CMG-9456. Please read the prospectus carefully before investing. The CMG SR Tactical Bond FundTM, CMG Global Equity FundTM and CMG Tactical Futures Strategy FundTM are distributed by Northern Lights Distributors, LLC, Member FINRA. NOT FDIC INSURED. MAY LOSE VALUE. NO BANK GUARANTEE.
Hypothetical Presentations: To the extent that any portion of the content reflects hypothetical results that were achieved by means of the retroactive application of a back-tested model, such results have inherent limitations, including: (1) the model results do not reflect the results of actual trading using client assets, but were achieved by means of the retroactive application of the referenced models, certain aspects of which may have been designed with the benefit of hindsight; (2) back-tested performance may not reflect the impact that any material market or economic factors might have had on the adviser’s use of the model if the model had been used during the period to actually mange client assets; and, (3) CMG’s clients may have experienced investment results during the corresponding time periods that were materially different from those portrayed in the model. Please Also Note: Past performance may not be indicative of future results. Therefore, no current or prospective client should assume that future performance will be profitable, or equal to any corresponding historical index. (i.e. S&P 500 Total Return or Dow Jones Wilshire U.S. 5000 Total Market Index) is also disclosed. For example, the S&P 500 Composite Total Return Index (the “S&P”) is a market capitalization-weighted index of 500 widely held stocks often used as a proxy for the stock market. Standard & Poor’s chooses the member companies for the S&P based on market size, liquidity, and industry group representation. Included are the common stocks of industrial, financial, utility, and transportation companies. The historical performance results of the S&P (and those of or all indices) and the model results do not reflect the deduction of transaction and custodial charges, or the deduction of an investment management fee, the incurrence of which would have the effect of decreasing indicated historical performance results. For example, the deduction combined annual advisory and transaction fees of 1.00% over a 10 year period would decrease a 10% gross return to an 8.9% net return. The S&P is not an index into which an investor can directly invest. The historical S&P performance results (and those of all other indices) are provided exclusively for comparison purposes only, so as to provide general comparative information to assist an individual in determining whether the performance of a specific portfolio or model meets, or continues to meet, his/her investment objective(s). A corresponding description of the other comparative indices, are available from CMG upon request. It should not be assumed that any CMG holdings will correspond directly to any such comparative index. The model and indices performance results do not reflect the impact of taxes. CMG portfolios may be more or less volatile than the reflective indices and/or models.
In the event that there has been a change in an individual’s investment objective or financial situation, he/she is encouraged to consult with his/her investment professionals.
Written Disclosure Statement. CMG is an SEC registered investment adviser principally located in King of Prussia, PA. Stephen B. Blumenthal is CMG’s founder and CEO. Please note: The above views are those of CMG and its CEO, Stephen Blumenthal, and do not reflect those of any sub-advisor that CMG may engage to manage any CMG strategy. A copy of CMG’s current written disclosure statement discussing advisory services and fees is available upon request or via CMG’s internet web site at (http://www.cmgwealth.com/disclosures/advs).
