Aug 5, 2022
By Steve Blumenthal
“MP3 reflationary policies injected massive amounts of money and credit into economies, leading to self-reinforcing high nominal growth, leading to self-reinforcing inflation, leading to an abrupt shift in market discounting from a benign monetary policy to a rapid tightening.
This discounting of a sharp tightening, its knock-on effects across markets, and the early stages of an actual tightening are producing the first transition in the economic environment since MP3 policies were enacted.
We are still in the early stages of this transition, and the path will depend a lot on how central bankers play their difficult hand, so one should not be firmly committed to one scenario or another. But as things now stand, odds favor a stagflationary environment that could last for years.”
– Bob Prince, Co-CIO, Bridgewater Associates in “Transitioning to Stagflation,” July 25, 2022
If you were invited to sit in the conference room of the world’s largest hedge funds, I’d bet you’d jump at the chance. You can imagine the dialog and debate that happens behind closed doors in investment committee meetings. Some personalities are strong, some less so. The collective input… invaluable. The best cultures encourage diverse views and voices. The objective is to determine what will likely happen (in economies, currencies, interest rates, and markets) and position accordingly.
There is a lot of noise in the financial press every day. My recommendation is to turn off CNBC and tune into Bob Prince, Greg Jensen, Ray Dalio, Stan Druckenmiller, Seth Klarman, Howard Marks, Mauldin, Hunt, and others. Especially investors with real skin in the game.
A few weeks ago, an OMR reader sent me a link to an excellent piece titled, “The Liquidity Hole is Expanding.” I forwarded it to my Evernote App with the idea of potentially sharing it with you at a later date. Here’s the gist: Most of the developed world’s central banks have moved from QE to QT. What does this mean for the direction of interest rates, the economy, capital flows, and various asset prices? What I like about this particular research piece is how well Bridgewaters’s Greg Jensen explains the dynamics in a way lay people might better understand.
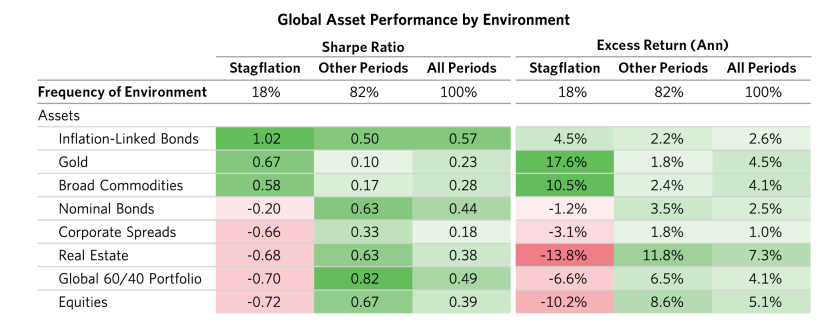
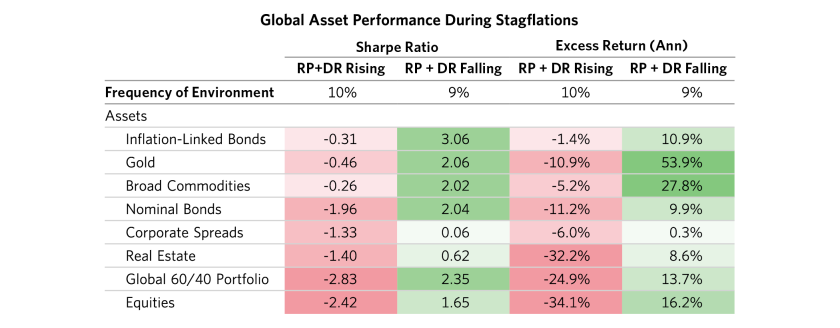
Today, we’ll take a look at the expanding liquidity hole and add a few charts from Bob Prince, Jensen’s fellow Bridgewater Co-CIO. Their conclusion? Odds favor stagflation. You’ll find some excellent charts that show which asset classes historically perform best/worst in stagflation environments. (Hint: It’s not 60/40 stocks/bonds. Yet that is where most of the money currently sits.)
But before you jump in, let’s take a quick look at a few of my favorite valuation metrics. I was particularly interested in them given July being the best performing month since 1939. Here are a few of my favorites:
Stock Market Capitalization as a Percentage of Nominal Gross Domestic Income
The following chart is fantastic in my view. It gives us a sense of how overvalued/undervalued the market is at any given point in time. Further, NDR plots the subsequent 1, 3, 5, 7, 9, and 11 year return performance averages of the S&P 500 index based on five quadrants that range from Most Overvalued (Top Quintile) to Most Undervalued (Bottom Quintile). Note the returns when the market is in the Top Quintile (where we find ourselves today). A good equity market investment target is the “We’d be better off here” green arrow in the center section of the chart. The best returns come when in the Bottom Quintile – Undervalued; however, getting that opportunity presents infrequently.

Shiller P/E
To understand the Shiller P/E ratio, you first must understand the price-to-earnings ratio (P/E ratio). The P/E ratio helps you decide whether a single company is undervalued or overvalued by comparing its stock price to its earnings per share (EPS). High P/E ratios generally signify a company is overvalued. Low ones indicate it may be a good value buy with the potential for high future returns. The problem is that standard P/E ratios can be unduly influenced by near-term changes in a company’s earnings performance that have little to do with its fundamentals and more to do with big market-moving economic events. Shiller smooths the earnings or “E” over ten years. Simply look at the current level relative to other periods in time. Under 20 is a good target area to start looking for equity investment opportunities, in my view.

Average of Crestmont P/E, Shiller P/E 10, Q Ratio and S&P Composite from its Regression
Note, that these indicators aren’t useful as short-term signals of market direction. Periods of over- and under-valuation can last for many years. But they can play a role in framing longer-term expectations of investment returns. At present, market overvaluation continues to suggest a cautious long-term performance outlook.

Source: Advisor Perspectives
Median PE
Note the large green arrow in the lower section of the chart. The investment target is 3,167.93. Of course, this is a moving target due to changes in earnings but what I like about this chart is that it incorporates actual earnings and not Wall Street future estimates, which tend to be too optimistic.
Take a look at how far the orange line has dropped from the near three standard deviation high (above 30). You can see valuations are improving, but the market remains 23.3% overvalued. Needed is a 1,000-point drop in the S&P 500 index to reach the 58.4-year Median PE value of 17.4 (indicated by the “We’d be better off here” green arrow). Median PE was 22.7 at the end of July. Better…

Grab your coffee and find your favorite chair. Today’s piece prints long due to the number of charts, but it reads pretty quickly. I hope you find it helpful. Please reach out to me if you have any questions.
The Liquidity Hole Is Expanding
At the end of last year, we described a liquidity hole that we expected would grow and envelop most assets. Last year, the fundamental conditions for assets (particularly bonds) deteriorated quickly, but asset purchases by the Fed combined with huge purchases by banks left asset markets swamped with money. That money worked its way to every corner of asset markets, leaving the pricing of many assets dependent on the continual flow of new purchases. The Fed’s late but abrupt reaction to inflation is now rippling through financial markets and, by our measures, is about to push the US economy into a recession and a significant decline in profits. In a Bloomberg interview Thursday, co-CIO Greg Jensen discussed the implications of this liquidity pullback and the Fed reaction function for different financial assets. In this report, we give an update on the big ongoing shifts we have discussed before that are behind what we are seeing today:
- The liquidity hole is expanding rapidly at the same time as interest rates are rising, creating a double whammy for financial assets. The Fed has shifted from massive quantitative easing in response to the COVID shock to quantitative tightening at a pace twice as large as that of past episodes. The Fed’s actions are most directly creating this liquidity hole in the bond market. As we noted, not only was the Fed itself buying bonds at a rapid pace during QE, but we also saw the banks plough the reserves created in this process back into bonds. Both are now sellers, and this liquidity shortfall is reverberating across financial assets broadly and hitting the frothiest segments the most. This is occurring alongside one of the fastest paces of interest rate tightening getting priced in that we have seen in decades.
- With inflation at center stage for policy makers today, the Fed’s reaction function to weakness in risk assets and the real economy is very different. Over the last several cycles, inflation was low, and as the economy weakened and the equity market fell, the Fed eased to sow the seeds for an economic recovery and a bottom in the stock market. This time, the Fed is constrained by intolerably high inflation such that even if the economy and stock market fall, it will need to maintain tighter policy for longer. A lot of Fed tightening is now priced into the rates markets, and there is a decent chance that the Fed will need to pivot earlier, depending on how weak the economy may get. But even if the Fed were to settle at above-target inflation of, say, 3%, that would still require short rates of something like 4% and would likely imply significant further downside for equities from here. All in all, the “Fed put” is at a way lower strike price than what we are used to.
- Financial assets are reconverging with the real economy and cash flows after materially outperforming. Over the past decade, we saw financial assets disconnect from the economy, first because of falling real yields and then due to the massive money printing and fiscal stimulus in response to the COVID shock. On top of compressing yields, actual cash flows for US companies also disconnected from the economy due to fiscal transfers supporting household spending, even as corporations cut back on labor costs, allowing profit margins to explode. We have so far only reversed a small part of this outperformance.
- We are likely still in the early innings of this reversal in equities: Despite the significant market action, the S&P has barely priced in a weaker economy, with earnings expectations remaining high and essentially most of the drawdown explained by the rising discount rates. This indicates that we have a lot more weakness for equities in store as their pricing converges with the economic reality, especially if the Fed tightens close to what the interest rate markets are reflecting.
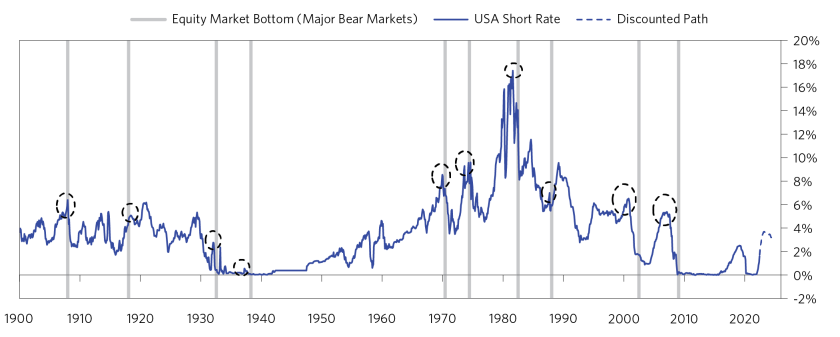
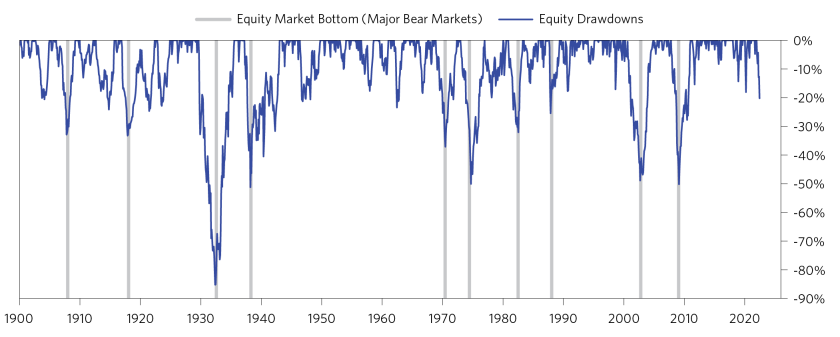
We went back and studied every major US equity bear market over the last 120 years and, in almost all cases, the bottoms either happened well into easing or at turning points in policy. The chart below highlights how the point where short rates roll over (circled) almost always precedes the equity market bottom (shaded).
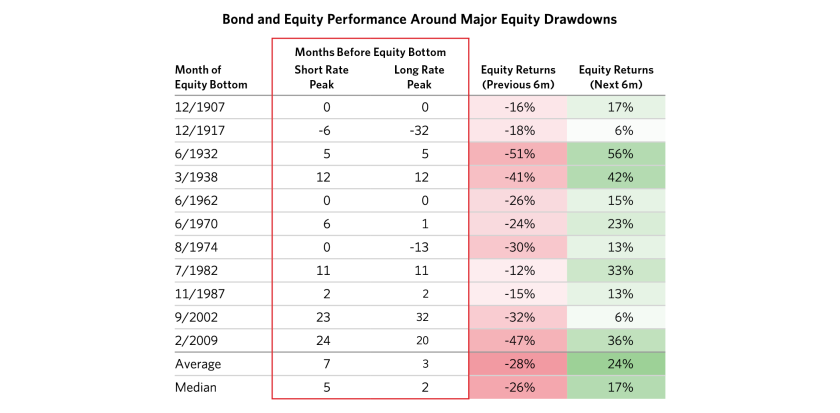
The second and third columns on the table below show how many months before the equity market bottom short rates and bond yields peaked. As you can see from the positive numbers, the equity markets almost always bottomed only after the interest rates had peaked and we were already in an easing phase.
To highlight the periods we chose for our study, the next chart shows the major drawdowns for the US equity market since 1900.
We now walk through the big themes that are driving the market action this year.
Financial Assets Are Facing the Double Whammy of the Liquidity Hole Expanding Rapidly at the Same Time as Interest Rates Are Rising
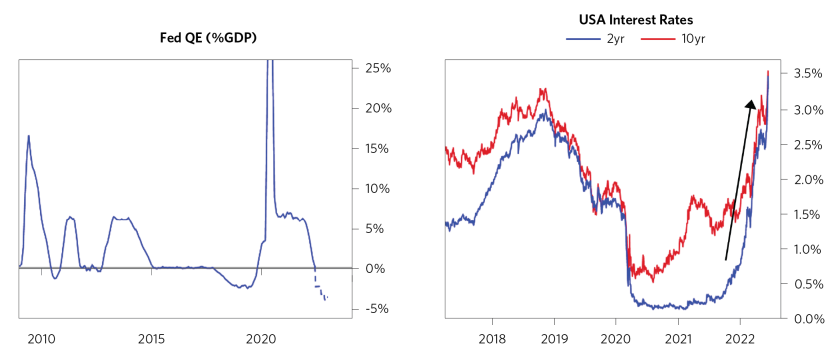
As you can see below, in response to the COVID shock, the Fed both quickly cut rates to near zero and embarked on a massive QE program, which was a major support to financial assets, particularly given that the economy was still locked down. As conditions have normalized and inflation has become a bigger concern, the Fed has started to rapidly withdraw this liquidity. The Fed is priced to sharply normalize interest rates from here and will be simultaneously shrinking its balance sheet at a massive $95 billion per month pace by September (reasonably faster than the last quantitative tightening).
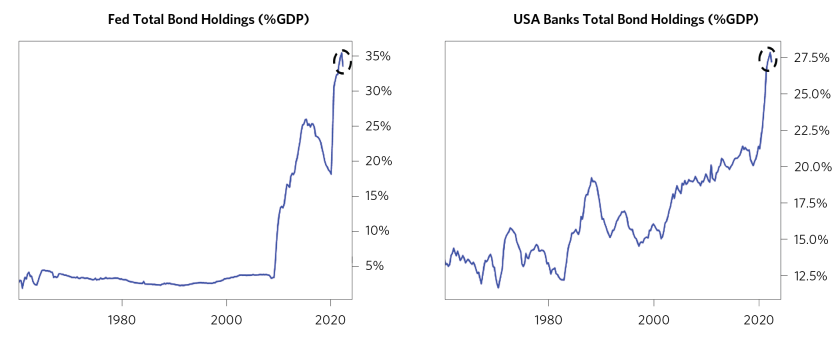
The liquidity hole is being created most directly in the bond market and is then reverberating across other assets. Not only was the Fed itself buying bonds at a rapid pace during QE, but we also saw the banks buy bonds at a pace never seen before. The pairing of QE with huge fiscal transfers and spending resulted in a very large amount of retail deposits landing on bank balance sheets. Given subdued private sector demand for credit, banks ploughed a record amount of these reserves into treasuries and agencies. Now, as the Fed is moving to selling bonds, banks are also turning from buyers to sellers, creating a large liquidity hole.
Given Inflation, Trade-Offs Facing the Fed Are Substantially More Complicated Today Than in the Past 40 Years
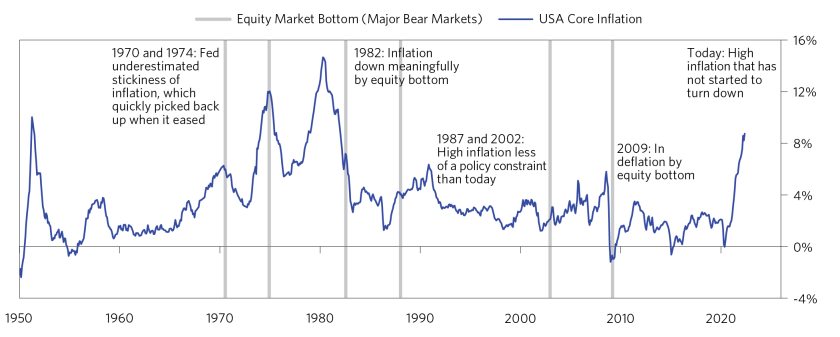
For the first time since the 1980s, inflation is a meaningful constraint for the Fed. The chart below illustrates how, in past cases, inflation was either not much of a policy constraint (e.g., the 1990s on) or meaningfully down by the time markets bottomed (i.e., 1982), or the Fed eased with a weakening economy but still high inflation (i.e., the 1970s). None of these situations seem likely today: inflation at 8% is a clear policy constraint; it has not turned over; and given this, the Fed is discounted to continue tightening.
We have already seen a major repricing in the rates markets in response to these conditions. The degree of discounted tightening today is about as large as any period in the last 50 years and will be a big deal for the economy if the Fed follows through.
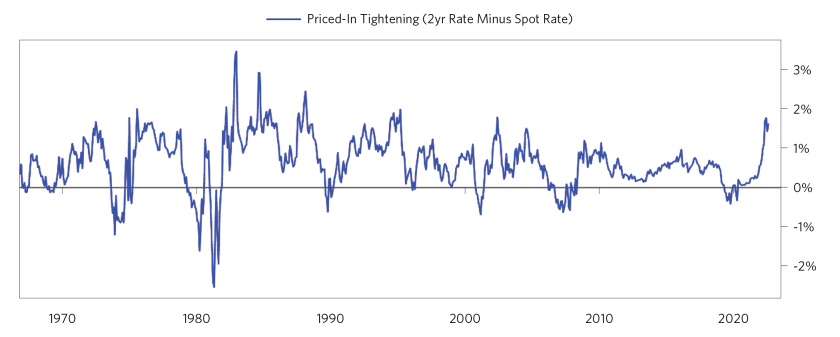
The Liquidity Hole Is Reverberating Across Financial Assets, and the Frothiest Stuff Has Been Hit the Most So Far; However, US Equities in Aggregate Have Barely Priced In Weaker Cash Flows
The pullback in liquidity has contributed to a major correction in some of the frothiest markets, with these moves accelerating in the last couple of days. For example, the unprofitable/emerging tech stocks, a retail favorite, have already fallen 50% off their 2021 peaks. Similarly, cryptocurrencies are in a steep drawdown. While deflating bubbles has not been a focus for the Fed, it is likely a welcome development.
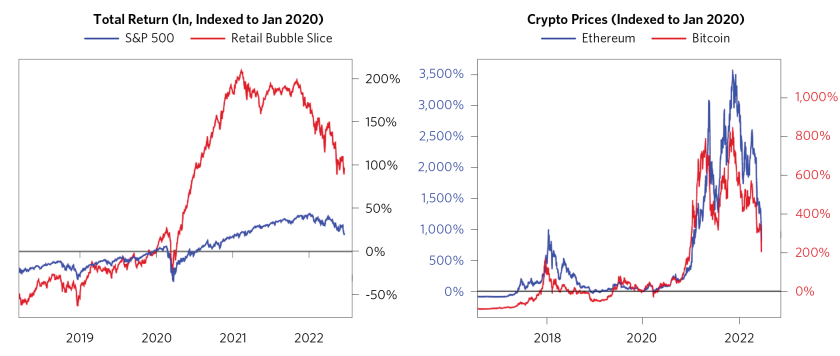
US equities are now down over 20% this year but are not pricing in the degree of real economic weakness we think is likely. The left chart below illustrates how, adjusted for discount rate changes, US equity returns would be close to flat this year. The chart on the right shows the priced-in EPS growth for US equities, which remains quite strong.
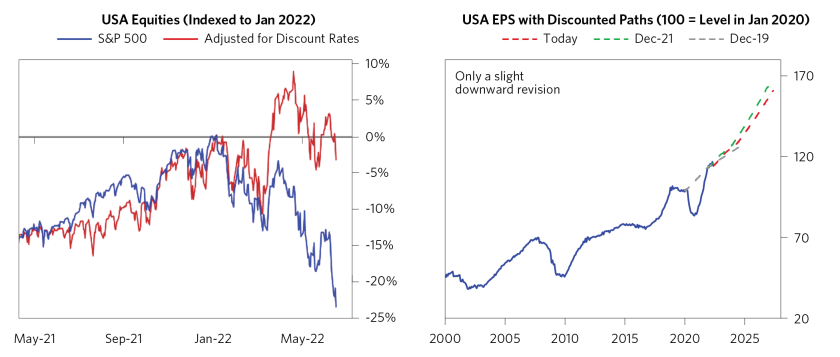
The Reconvergence of Financial Assets and the Real Economy and Cash Flows Is Still in the Early Innings
Since the financial crisis, financial asset returns have meaningfully outpaced nominal growth. In the 2010s, this was in large part because secularly low real yields supported asset valuations, fostering strong performance for both bonds and the liquidity-sensitive equities that played an increasingly large role in the US equity market. This divergence widened with government stimulus during the COVID shock: unique MP3 dynamics supported higher equity multiples as fiscal support elevated household savings, which in turn were increasingly channeled back into equity markets as retail participation surged.
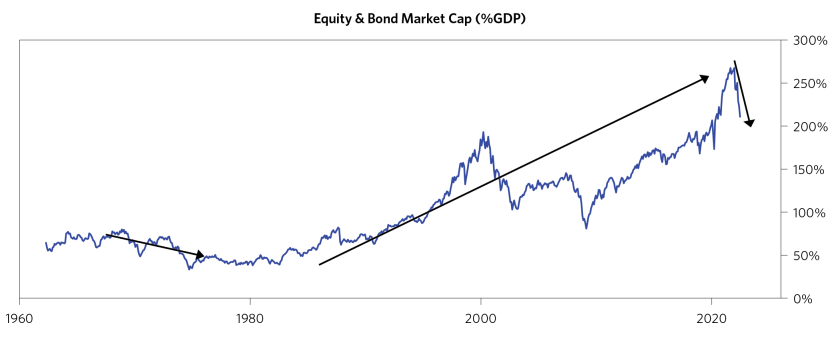
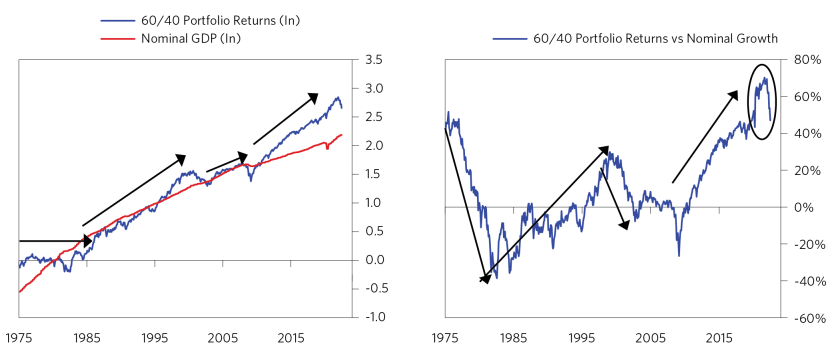
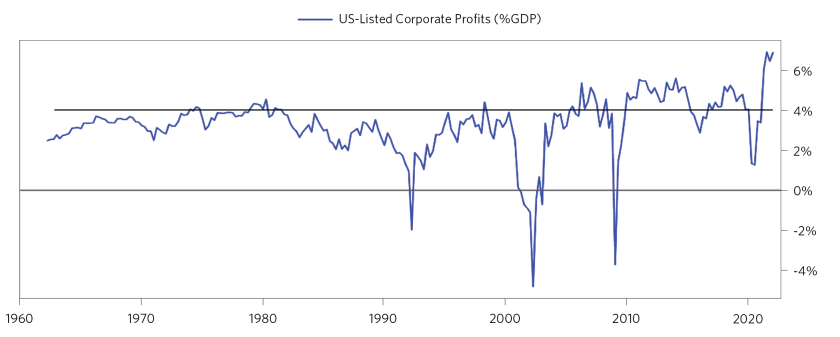
On top of this, the MP3 dynamics also allowed corporate profits to disconnect from the overall economy. Fiscal transfers to households more than offset the loss in private incomes during the shock, allowing households to maintain their spending power. A result of this was that US corporations were able to collect higher revenues from the household sector without paying correspondingly higher wages—again, only because these workers were subsidized by government stimulus transfers (borrowing that was monetized by quantitative easing). This caused profit margins to balloon and elevated corporate cash flows. As this stimulus wears off and fiscal spending pulls back, there is significant pressure for corporates’ profit share to normalize in an environment where private sector wages are rising.
For discussion purposes only. Talk with your investment advisor. Not a recommendation to buy or sell any security.
If you are not signed up to receive the free weekly On My Radar letter,
you can sign up here.
An Update from Our CIOs: Transitioning to Stagflation
- Thus, the degree and duration of the tightening must be strong enough and long-lasting enough to bring credit growth down by enough (roughly by half) for long enough—to bring spending down by enough for long enough—to weaken labor markets by enough—to bring wages down by enough—that NGDP growth falls by enough and stays there—to bring inflation down to 2.5%. Historically, the average lead time of a decline in labor markets to a decline in wages is about two years, with a wide range around that average. (emphasis his)
- The shift from QE to QT has its most direct impacts on financial markets. Applying the template described earlier in this letter, after the central bank prints money (M), it pushes that money into the economy through the financial markets (F). The impact on interest rates and asset prices indirectly influences spending. Over the past decade, the aggressive use of QE and then MP3 flooded financial markets with liquidity and caused them to substantially outperform the actual economy. The shift from QE to QT is having the reverse impact, drawing funds more directly from the financial markets and indirectly impacting spending. This, combined with ongoing heavy issuance of treasuries, is producing a liquidity hole in the financial markets that spreads from bonds to stocks and is likely to cause financial markets to underperform the economy.
- Policy tightening is likely to slow inflation from where it has been, but whether it brings inflation down to what is discounted (2.5%) and to what the Fed expects and is targeting (2%) depends on how deep the contraction is and how long it lasts. It needs to be deep and long-lasting because there is inertia in the system in the form of wage growth that is much higher than what would be required for 2.5% inflation. This link here will take you to the full letter. Following I share a few charts with my notes to shorten this week’s OMR. I do recommend you read the full piece on the Bridgewater website.
- Looking further forward, this stagflationary environment is ripe for instability and volatility over the coming decade as policy makers will be challenged to achieve their mandates with pressures on them coming from all sides. To make matters worse, policy makers seem to have an inadequate understanding of the forces at work (e.g., see the Jackson Hole speeches last August), which raises the odds of continued policy errors. Bridgewater Associates, LP disclouses
This research paper is prepared by and is the property of Bridgewater Associates, LP and is circulated for informational and educational purposes only. There is no consideration given to the specific investment needs, objectives or tolerances of any of the recipients. Additionally, Bridgewater’s actual investment positions may, and often will, vary from its conclusions discussed herein based on any number of factors, such as client investment restrictions, portfolio rebalancing and transactions costs, among others. Recipients should consult their own advisors, including tax advisors, before making any investment decision. This report is not an offer to sell or the solicitation of an offer to buy the securities or other instruments mentioned.
Bridgewater research utilizes data and information from public, private and internal sources, including data from actual Bridgewater trades. Sources include, Arabesque ESG Book, Bloomberg Finance L.P., Bond Radar, Candeal, Capital Economics, CBRE, Inc., CEIC Data Company Ltd., Clarus Financial Technology, Conference Board of Canada, Consensus Economics Inc., Corelogic, Inc., Cornerstone Macro, Dealogic, DTCC Data Repository, Ecoanalitica, Empirical Research Partners, Entis (Axioma Qontigo), EPFR Global, Eurasia Group, Evercore ISI, Factset Research Systems, The Financial Times Limited, FINRA, GaveKal Research Ltd., Global Financial Data, Inc., Harvard Business Review, Haver Analytics, Inc., Institutional Shareholder Services (ISS), The Investment Funds Institute of Canada, ICE Data, ICE Derived Data (UK), Investment Company Institute, International Institute of Finance, JP Morgan, MarketAxess, Medley Global Advisors, Metals Focus Ltd, Moody’s ESG Solutions, MSCI, Inc., National Bureau of Economic Research, OAG Aviation, Organisation for Economic Cooperation and Development, Pensions & Investments Research Center, Refinitiv, Rhodium Group, RP Data, Rystad Energy, S&P Global Market Intelligence, Sentix Gmbh, Shanghai Wind Information, Sustainalytics, Swaps Monitor, Totem Macro, Tradeweb, United Nations, US Department of Commerce, Verisk Maplecroft, Visible Alpha, Wells Bay, Wind Financial Information LLC, Wood Mackenzie Limited, World Bureau of Metal Statistics, World Economic Forum, YieldBook. While we consider information from external sources to be reliable, we do not assume responsibility for its accuracy.
The views expressed herein are solely those of Bridgewater as of the date of this report and are subject to change without notice. Bridgewater may have a significant financial interest in one or more of the positions and/or securities or derivatives discussed. Those responsible for preparing this report receive compensation based upon various factors, including, among other things, the quality of their work and firm revenues.
Trade Signals: Path, Depth and Duration
Market Commentary
July 28, 2022
S&P 500 Index — 4,070
Notable this week:
The following August 3, 2022 update piece is from Axios Macro. It does a good job summing up the recent moves in the equity and fixed income markets:
Federal Reserve officials have watched closely as interest rates plunged the last few weeks. Apparently, they don’t like what they see.
- Markets were becoming too confident in future easing, starting to price in only modest rate increases, and indicate possible cuts next year. That partially reversed yesterday after some hawkish Fed talk.
Why it matters: Traders have been betting that the Fed will eventually back off its tightening campaign, but the Fed is saying “not so fast.”
State of play: The yield on 10-year Treasury bonds has fallen from 3.48% in mid-June to 2.61% Monday, as investors started to bet on lower inflation. With that may come less aggressive monetary tightening.
- The fed lowered mortgage rates, and fueled a July surge in risk-sensitive assets.
- To an extent, markets were declaring “mission accomplished,” with pricing implying the Fed’s war on inflation was close to being won.
Yes, but: Markets have gotten ahead of the Fed itself. The central bank is giving the clear sense they still need to keep pushing rates upward and do not expect to end up cutting next year.
- “We are still resolute and completely united on achieving price stability, which doesn’t mean 9.1% inflation…so a long way to go,” said Mary Daly, San Francisco Fed President, in an interview on LinkedIn. “It really would be premature to unwind all of that and say the job is done.”
- Cleveland Fed President Loretta Mester told the Washington Post that she needs to see “very compelling evidence” price pressures are receding.
- And Minneapolis Fed President Neel Kashkari pronounced himself “surprised by markets’ interpretation,” telling the New York Times the Fed will “continue to do what we need to do until we are convinced that inflation is well on its way back down to 2 percent — and we are a long way away from that.”
In an interview with Axios, Richmond Fed President Tom Barkin emphasized the need for policy that’s appropriately restrictive.
- “I think we’re going to need to get real forward-looking interest rates into positive territory throughout the yield curve,” Barkin told Axios Raleigh’s Zachery Eanes. “Near-term rates are not above near-term inflation and I think we’re going to need that.”
The Fed officials are worried that market moves are undermining their tightening strategy — and implicitly, that they are more determined to keep up the pressure than market prices imply.
- Bonds are getting the message. The 10-year yield is back up to 2.82% this morning, and the five-year real yield is back up to 0.2% this morning.
The bottom line: There is a dance occurring between the Fed and markets, with the central bank pushing back when markets turn complacent. There should be a lesson for anyone who expects the path toward disinflation to be painless. Source
Bear Markets: Depth and Duration
There is no way of knowing if we will have a mild correction in the 20% range (as has occurred in the current bear market) in the S&P 500 Index or a far greater correction similar to what happened in 2008-09 and 2000-02. History tells us the most severe corrections come in recession. That debate is active right now. Hard to bet against an inverted yield curve, problematic inflation, and an aggressive Fed. I sit in the “hard” landing camp.
What I like about this chart is that it tracks both the depth and the duration of the three most significant bear market declines. Importantly, it shows the 1973 “stagflation” bear market decline. My best guess on what I believe to be our current challenges. The blue line is the current decline through June 2022. The yellow line is a reasonable probability in terms of the path, depth of decline, and duration.

Bottom line: The above chart (blue line) isn’t yet updated for July’s strong performance month. In fact, the S&P 500 posted its best July since 1939 (according to Ned Davis Research). Bear market rallies are impressive. Is the bear market over? In my view, and I could be wrong, we are a few months away from a potential halfway point in the current bear market. Probabilities favor “Stagflation.”
The Dashboard of Indicators follows next. Short-term sentiment turned to “extreme optimism” this week, which is short-term bearish for equities. The two-year vs. 10-year Treasury curve has turned negative, meaning short-term yields are higher than long-term yields. It sits at -0.37%. Inversions happen infrequently and signal the economy has a bad fever. The recession prediction track record is excellent, though not a guarantee. The bond indicators are bullish. Don’t Fight the Tape or the Fed moved to a neutral 0 score. The equity indicators remain bearish except for the S&P 500 Index Daily MACD. The short-term oriented Daily MACD has done a good job signaling the current bear market rally. It appears to be reaching levels attained during prior rally highs. That and the extreme investor optimism on the NDR Daily Trading Sentiment Composite suggest caution.
Click HERE to see the Dashboard of Indicators and all the updated charts in Wednesday’s Trade Signals post.
Not a recommendation for you to buy or sell any security. For information purposes only. Please talk with your advisor about needs, goals, time horizon, and risk tolerances.
If you are not signed up to receive the free weekly On My Radar letter,
you can sign up here.
Personal Note – Detroit, Vancouver and British Columbia
Golf is planned for this weekend. Son Kyle is home for the month before his move to LA in September. Though he doesn’t yet know it, good friend Steve Oh lit the spark—Kyle loves playing golf. That is music to dad’s ears, and the plan is to slow down in August and play as much golf as I can with Kyle.
Susan and I are hoping to sneak away to Stone Harbor or Cape May, New Jersey, for a few days on the beach mid-month. A two-day business trip to Detroit is on the books for August 23 and 24, and then the big one: I’m flying to Vancouver on August 27, and from there, I’ll fly farther north, then helicopter to a remote island in British Columbia for four days of salmon fishing at a place called The West Coast Fishing Club. It is a fishing lodge located on the shores of Haida Gwaii, BC, on the northwest coast of Canada. I’m told it is the best salmon and halibut fishing in the world. A good friend and client, Jim T, invited Mauldin and me, and we said “YES.” I know, poor Steve. Checking in lucky, happy, and very excited.
The guides filet the catch as soon as you come ashore, flash freeze the fish, and ship it home. Here is a glimpse… I’ve been following their weekly reports. Looks amazing.

The red arrow is the location of the island.


I hope you have some fun planned for the near future. Wishing you and your family the very best!
Have a great week!
Steve
Stephen B. Blumenthal
Executive Chairman & CIO
CMG Capital Management Group, Inc.
If you are not signed up to receive the free weekly On My Radar letter,
you can sign up here.
Forbes Book – On My Radar, Navigating Stock Market Cycles. Stephen Blumenthal gives investors a game plan and the advice they need to develop a risk-minded and opportunity-based investment approach. It is about how to grow and defend your wealth. You can learn more here.

Stephen Blumenthal founded CMG Capital Management Group in 1992 and serves today as its Executive Chairman and CIO. Steve authors a free weekly e-letter entitled, “On My Radar.” Steve shares his views on macroeconomic research, valuations, portfolio construction, asset allocation and risk management.
Follow Steve on Twitter @SBlumenthalCMG and LinkedIn.
IMPORTANT DISCLOSURE INFORMATION
This document is prepared by CMG Capital Management Group, Inc. (“CMG”) and is circulated for informational and educational purposes only. There is no consideration given to the specific investment needs, objectives, or tolerances of any of the recipients. Additionally, CMG’s actual investment positions may, and often will, vary from its conclusions discussed herein based on any number of factors, such as client investment restrictions, portfolio rebalancing, and transaction costs, among others. Recipients should consult their own advisors, including tax advisors, before making any investment decision. This material is for informational and educational purposes only and is not an offer to sell or the solicitation of an offer to buy the securities or other instruments mentioned. This material does not constitute a personal recommendation or take into account the particular investment objectives, financial situations, or needs of individual investors which are necessary considerations before making any investment decision. Investors should consider whether any advice or recommendation in this research is suitable for their particular circumstances and, where appropriate, seek professional advice, including legal, tax, accounting, investment, or other advice.
Investing involves risk. Past performance does not guarantee or indicate future results. Different types of investments involve varying degrees of risk, and there can be no assurance that the future performance of any specific investment, investment strategy, or product (including the investments and/or investment strategies recommended or undertaken by CMG), or any non-investment related content, made reference to directly or indirectly in this commentary will be profitable, equal any corresponding indicated historical performance level(s), be suitable for your portfolio or individual situation or prove successful. Due to various factors, including changing market conditions and/or applicable laws, the content may no longer be reflective of current opinions or positions. Moreover, you should not assume that any discussion or information contained in this commentary serves as the receipt of, or as a substitute for, personalized investment advice from CMG. Please remember to contact CMG, in writing, if there are any changes in your personal/financial situation or investment objectives for the purpose of reviewing/evaluating/revising our previous recommendations and/or services, or if you would like to impose, add, or to modify any reasonable restrictions to our investment advisory services. Unless, and until, you notify us, in writing, to the contrary, we shall continue to provide services as we do currently. CMG is neither a law firm, nor a certified public accounting firm, and no portion of the commentary content should be construed as legal or accounting advice.
No portion of the content should be construed as an offer or solicitation for the purchase or sale of any security. References to specific securities, investment programs or funds are for illustrative purposes only and are not intended to be, and should not be interpreted as recommendations to purchase or sell such securities.
This presentation does not discuss, directly or indirectly, the amount of the profits or losses realized or unrealized, by any CMG client from any specific funds or securities. Please note: In the event that CMG references performance results for an actual CMG portfolio, the results are reported net of advisory fees and inclusive of dividends. The performance referenced is that as determined and/or provided directly by the referenced funds and/or publishers, has not been independently verified, and does not reflect the performance of any specific CMG client. CMG clients may have experienced materially different performance based upon various factors during the corresponding time periods. See in links provided citing limitations of hypothetical back-tested information. Past performance cannot predict or guarantee future performance. Not a recommendation to buy or sell. Please talk to your advisor.
Information herein has been obtained from sources believed to be reliable, but we do not warrant its accuracy. This document is general communication and is provided for informational and/or educational purposes only. None of the content should be viewed as a suggestion that you take or refrain from taking any action nor as a recommendation for any specific investment product, strategy, or other such purposes.
In a rising interest rate environment, the value of fixed-income securities generally declines, and conversely, in a falling interest rate environment, the value of fixed-income securities generally increases. High-yield securities may be subject to heightened market, interest rate, or credit risk and should not be purchased solely because of the stated yield. Ratings are measured on a scale that ranges from AAA or Aaa (highest) to D or C (lowest). Investment-grade investments are those rated from highest down to BBB- or Baa3.
NOT FDIC INSURED. MAY LOSE VALUE. NO BANK GUARANTEE.
Certain information contained herein has been obtained from third-party sources believed to be reliable, but we cannot guarantee its accuracy or completeness.
In the event that there has been a change in an individual’s investment objective or financial situation, he/she is encouraged to consult with his/her investment professional.
Written Disclosure Statement. CMG is an SEC-registered investment adviser located in Malvern, Pennsylvania. Stephen B. Blumenthal is CMG’s founder and CEO. Please note: The above views are those of CMG and its CEO, Stephen Blumenthal, and do not reflect those of any sub-advisor that CMG may engage to manage any CMG strategy, or exclusively determines any internal strategy employed by CMG. A copy of CMG’s current written disclosure statement discussing advisory services and fees is available upon request or via CMG’s internet web site at www.cmgwealth.com/disclosures. CMG is committed to protecting your personal information. Click here to review CMG’s privacy policies.


